RightMark Audio Analyzer test report#
| Testing device | Gigaworks modified |
|---|
| Sampling mode | 24-bit, 44 kHz |
| Interface | |
| Testing chain | External loopback (line-out - line-in) |
| RMAA Version | 6.1.2 |
| |
| |
| 20 Hz - 20 kHz filter | ON |
| Normalize amplitude | ON |
| Level change | -1.1 dB / -1.2 dB |
| Mono mode | OFF |
| Calibration singal, Hz | 1000 |
| Polarity | correct/correct |
Modifications: Removed second opamp. Removed L+,L-,R+,R- input caps. Removed filter caps around opamp, C1, C2, C3 C4, C6. R13 and R14 lifted to get signal out directly to RCA. Check DC offset before plugging in. The mod is temporary, will test with Cirrus Logic’s low-pass filter example later on…
Summary#
| Frequency response (from 40 Hz to 15 kHz), dB | +0.07, -0.60 | Good |
|---|
| Noise level, dB (A) | -109.9 | Excellent |
| Dynamic range, dB (A) | 109.8 | Excellent |
| THD, % | 0.0008 | Excellent |
| THD + Noise, dB (A) | -96.2 | Excellent |
| IMD + Noise, % | 0.0020 | Excellent |
| Stereo crosstalk, dB | -108.7 | Excellent |
| IMD at 10 kHz, % | 0.0021 | Excellent |
| General performance | | Excellent |
Frequency response#
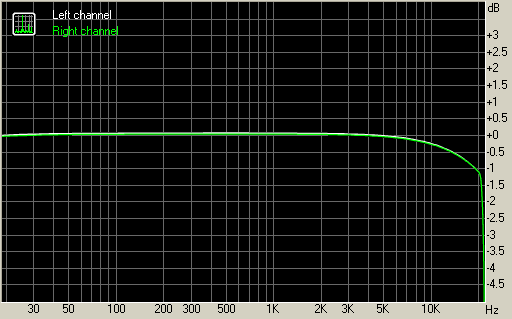
| From 20 Hz to 20 kHz, dB | -1.07, +0.07 |
|---|
| From 40 Hz to 15 kHz, dB | -0.60, +0.07 |
Noise level#
| Left | Right |
|---|
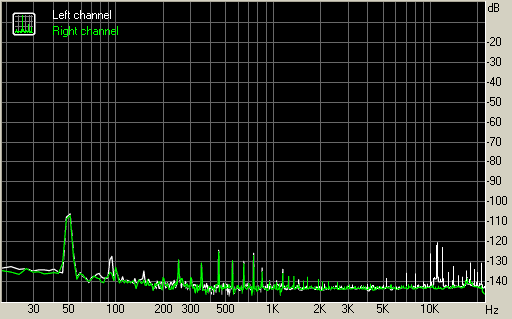
| RMS power, dB | -104.9 | -105.6 |
| RMS power (A-weighted), dB | -109.6 | -110.2 |
| Peak level, dB FS | -87.4 | -87.5 |
| DC offset, % | +0.0 | +0.0 |
Dynamic range#
| Left | Right |
|---|
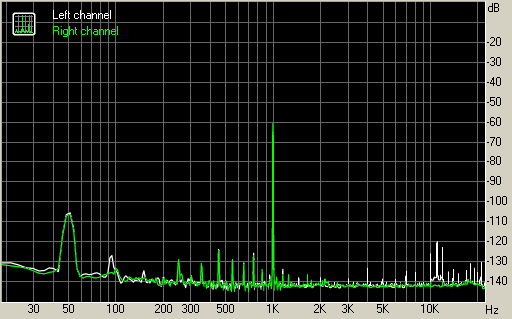
| Dynamic range, dB | +104.9 | +105.8 |
| Dynamic range (A-weighted), dB | +109.5 | +110.2 |
| DC offset, % | +0.00 | +0.00 |
THD + Noise (at -3 dB FS)#
| Left | Right |
|---|
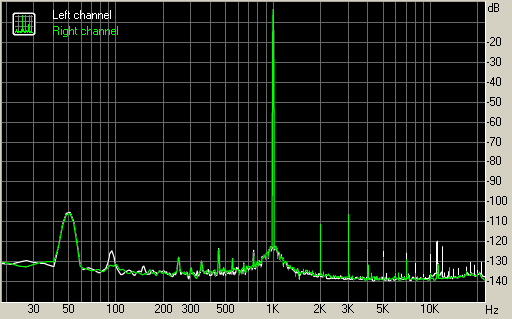
| THD, % | +0.0008 | +0.0008 |
| THD + Noise, % | +0.0016 | +0.0016 |
| THD + Noise (A-weighted), % | +0.0015 | +0.0016 |
Intermodulation distortion#
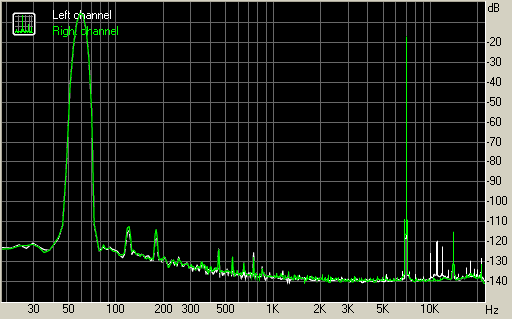
| Left | Right |
|---|
| IMD + Noise, % | +0.0021 | +0.0020 |
| IMD + Noise (A-weighted), % | +0.0014 | +0.0014 |
Stereo crosstalk#
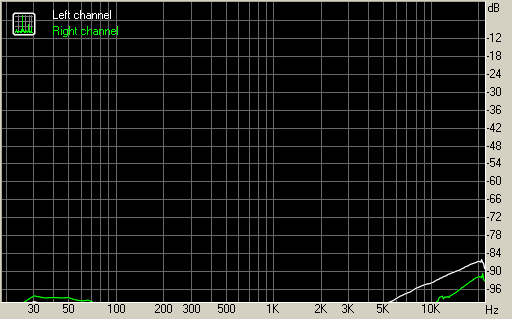
| Left | Right |
|---|
| Crosstalk at 100 Hz, dB | -108 | -105 |
| Crosstalk at 1000 Hz, dB | -107 | -109 |
| Crosstalk at 10000 Hz, dB | -93 | -101 |
IMD (swept tones)#
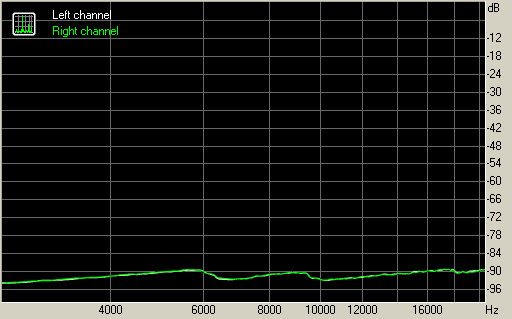
| Left | Right |
|---|
| IMD + Noise at 5000 Hz, | 0.0020 | 0.0021 |
| IMD + Noise at 10000 Hz, | 0.0020 | 0.0021 |
| IMD + Noise at 15000 Hz, | 0.0020 | 0.0021 |